
Global air traffic is nearing a turning point and we could soon hit nearly 10 billion annual air passengers worldwide. In 2024, there were about 9.5 billion travellers, roughly a 9% bump over 2023, which shows a strong bounce back. Looking ahead to 2025, the picture is mixed; there are many opportunities alongside some fresh hurdles.
Record breaking air traffic and top airports
The ten busiest airports managed roughly 855 million travellers, or around 10% of all air passengers, marking an increase of nearly 8.8% compared to 2022.
Globally, Atlanta, Dubai, and Dallas airports took the top spots, while Shanghai Pudong airport made a surprisingly big jump from 21st to 10th position with 76.7 million passengers, a 41% leap from last year. Istanbul (80 million) and New Delhi (78 million) stayed in strong positions, even as new contenders from China started stirring the pot a bit.
The Asia-Pacific area is one big mover here, mainly because of more relaxed visa rules and China reconnecting on international routes. Even smaller hubs are picking up extra air passengers as improved global linkages and infrastructure investments play their part too.
Full-year international traffic surpassed the previous 2019 high by 0.5% in 2024, with growth in all regions. Capacity was 0.9% lower than 2019. The load factor improved by 0.5 percentage points, finishing on 83.2%, a record high.
For the month of December 2024, international demand grew by 10.6%, capacity increased 7.7% and the load factor improved by 2.2 percentage points (compared to December 2023) to 83.9%.
Asia-Pacific airlines posted a 26.0% rise in full year international 2024 traffic compared to 2023, maintaining the strongest year-over-year rate among the regions. Capacity rose 24.7% and the load factor climbed 0.8 percentage points to 83.8%. Despite this strong growth, opportunities for further growth remain high, as international RPKs remain 8.7% below 2019 levels. December 2024 traffic rose 17.1% compared to December 2023.
European carriers’ full year traffic climbed 9.7% versus 2023. Capacity increased 9.2%, and load factor rose 0.4 percentage points to 84.1%. For December, demand climbed 8.6% compared to the same month in 2023.
Middle Eastern airlines saw a 9.4% traffic rise in 2024 compared to 2023. Capacity increased 8.4% and load factor climbed 0.7 percentage points to 80.8%. December demand climbed 7.7% compared to the same month in 2023.
North American carriers reported a 6.8% annual traffic rise in 2024 compared to 2023. Capacity increased 7.4%, and load factor fell -0.5 percentage points to 84.2%. December 2024 traffic rose 5.1% compared to the year-ago period.
Latin American airlines posted a 14.4% traffic rise in 2024 over full year 2023. Annual capacity climbed 14.3% and load factor increased 0.1 percentage points to 84.8%, the highest among the regions. December demand climbed 11.3% compared to December 2023.
African airlines’ annual traffic rose 13.2% in 2024 versus the prior year. Full year 2024 capacity was up 9.5% and load factor climbed 2.5 percentage points to 74.5%, the lowest among regions but a record high for Africa. December 2024 traffic for African airlines rose 12.4% over December 2023.
People want to travel in record numbers
2024 made it absolutely clear that people want to travel. With 10.4% demand growth, travel reached record numbers domestically and internationally. Airlines met that strong demand with record efficiency. On average, 83.5% of all seats on offer were filled, a new record high, partially attributable to the supply chain constraints that limited capacity growth.
- Total full-year traffic in 2024 (measured in revenue passenger kilometres or RPKs) rose 10.4% compared to 2023. This was 3.8% above pre-pandemic (2019) levels. Total capacity, measured in available seat kilometres (ASK), was up 8.7% in 2024. The overall load factor reached 83.5%, a record for full-year traffic.
- International full-year traffic in 2024 increased 13.6% compared to 2023, and capacity rose 12.8%.
- Domestic full-year traffic for 2024 rose 5.7% compared to the prior year, while capacity expanded by 2.5%.
- December 2024 was a strong finish to the year with overall demand rising 8.6% year-on-year, and capacity grew by 5.6%. International demand rose by 10.6% and domestic demand by 5.5%. The December load factor reached 84%, a record for the month.
2025 travel numbers – Steady but slower growth
Looking into 2025, projections point to around 9.9 billion passengers, a growth rate of roughly 4.8%, which is a gentler climb than before. Generally speaking, while demand remains sturdy, the explosive recovery is easing into a steadier, long-term expansion model.
Still, challenges are on the horizon; economic jitters, political tensions, and capacity limits could cramp the pace. In established markets, growth is expected to plateau somewhat due to lingering supply chain bottlenecks and airport capacity issues. On the flip side, emerging markets might continue to surge, spurred by fresh infrastructure spending and a booming middle class hungry for air traffic.
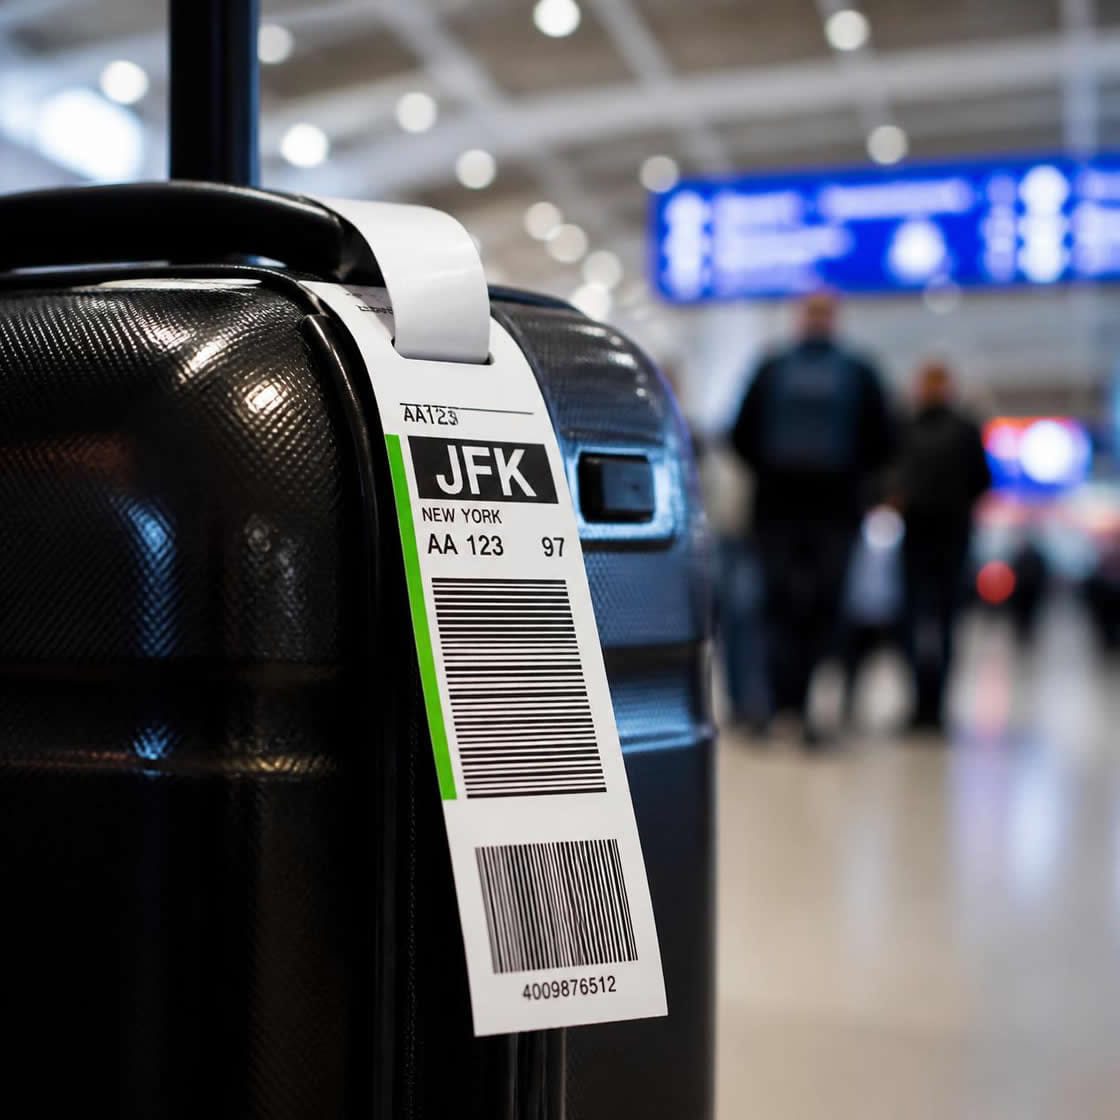
Travel smarter with a QR code for your suitcase - Create a free account
QRtrav helps to reduce lost luggage issues for international travellers by offering a free QR code tagging solution for suitcases and personal items.Setting up your free QRtrav profile ID, downloading your QR code, printing and attaching it to your luggage or personal belongings takes no time at all. To get started - Create a free account
Find out more about our company - About our QR code travel service


